Most aurora apps ask you to trust a number. This page explains exactly where ours comes from, what it's measuring, and just as importantly, what it can't tell you. If you'd rather skip the physics, the features page covers what you'll see on screen.
The score is a composite. It's recalculated every five minutes from live data and refreshed in your app every sixty seconds. Four things drive it.
The Sun's magnetic field is carried outward by the solar wind. When the north south component of that field points south, it's opposite to Earth's field at the front of the magnetosphere and the two reconnect, opening a door that lets solar wind energy pour in. When it points north the door stays shut and very little happens no matter how fast the wind is blowing.
This is why a 700 km/s stream can produce nothing at all, and a modest 450 km/s wind with a steady southward field can light up the whole South Island. Both the instant value and rolling 10 and 30 minute averages are used, because a brief southward flick that immediately recovers is worth far less than sustained southward field. Bz below minus 5 nT held for fifteen minutes or more is the strongest single predictor of aurora at our latitudes.
Bz on its own isn't the whole story. Speed and total transverse field matter too. The Newell coupling function combines solar wind speed, field strength and the field's clock angle into a single physics derived rate of energy input into the magnetosphere. It's a standard in the field, and it's what lets the app tell "southward field, but weak and slow" apart from "southward field with real power behind it".
NOAA's GOES-18 and GOES-19 satellites measure how much energy is being dumped into the ionosphere by particles falling into the auroral zones, in gigawatts. This isn't a model. It's a direct measurement of aurora being produced right now. Above 20 GW is active, above 50 GW is significant, above 100 GW is a major storm. It's used to confirm that the coupling the solar wind data implies is genuinely turning into aurora.
GeoNet runs a magnetic observatory at Eyrewell in Canterbury. It reports how fast the horizontal magnetic field is changing, once a minute. When the auroral electrojet switches on overhead, that trace drops sharply. A drop of 50 nT or more inside fifteen minutes means a substorm current is flowing above New Zealand at that moment.
No global index can tell you that. It's the reason the score can differ sharply from a Kp based forecast, and usually the reason it's right when they're wrong.
The base score is calculated for Greymouth on the West Coast. If you allow location access, it's adjusted for your actual position, roughly 0.2 percent per 10 km of latitude difference. Further south, closer to the oval, and your score goes up. Further north and it comes down.
It's deliberately conservative. The point isn't to promise Invercargill twice as much aurora as Auckland. It's to stop a single national number from misleading people at either end of the country.
Your location never leaves your control. It's used on your device for the displayed score. It is never logged, sold, or shared with a third party. Decline it and the app still works, you just get the Greymouth reference score.
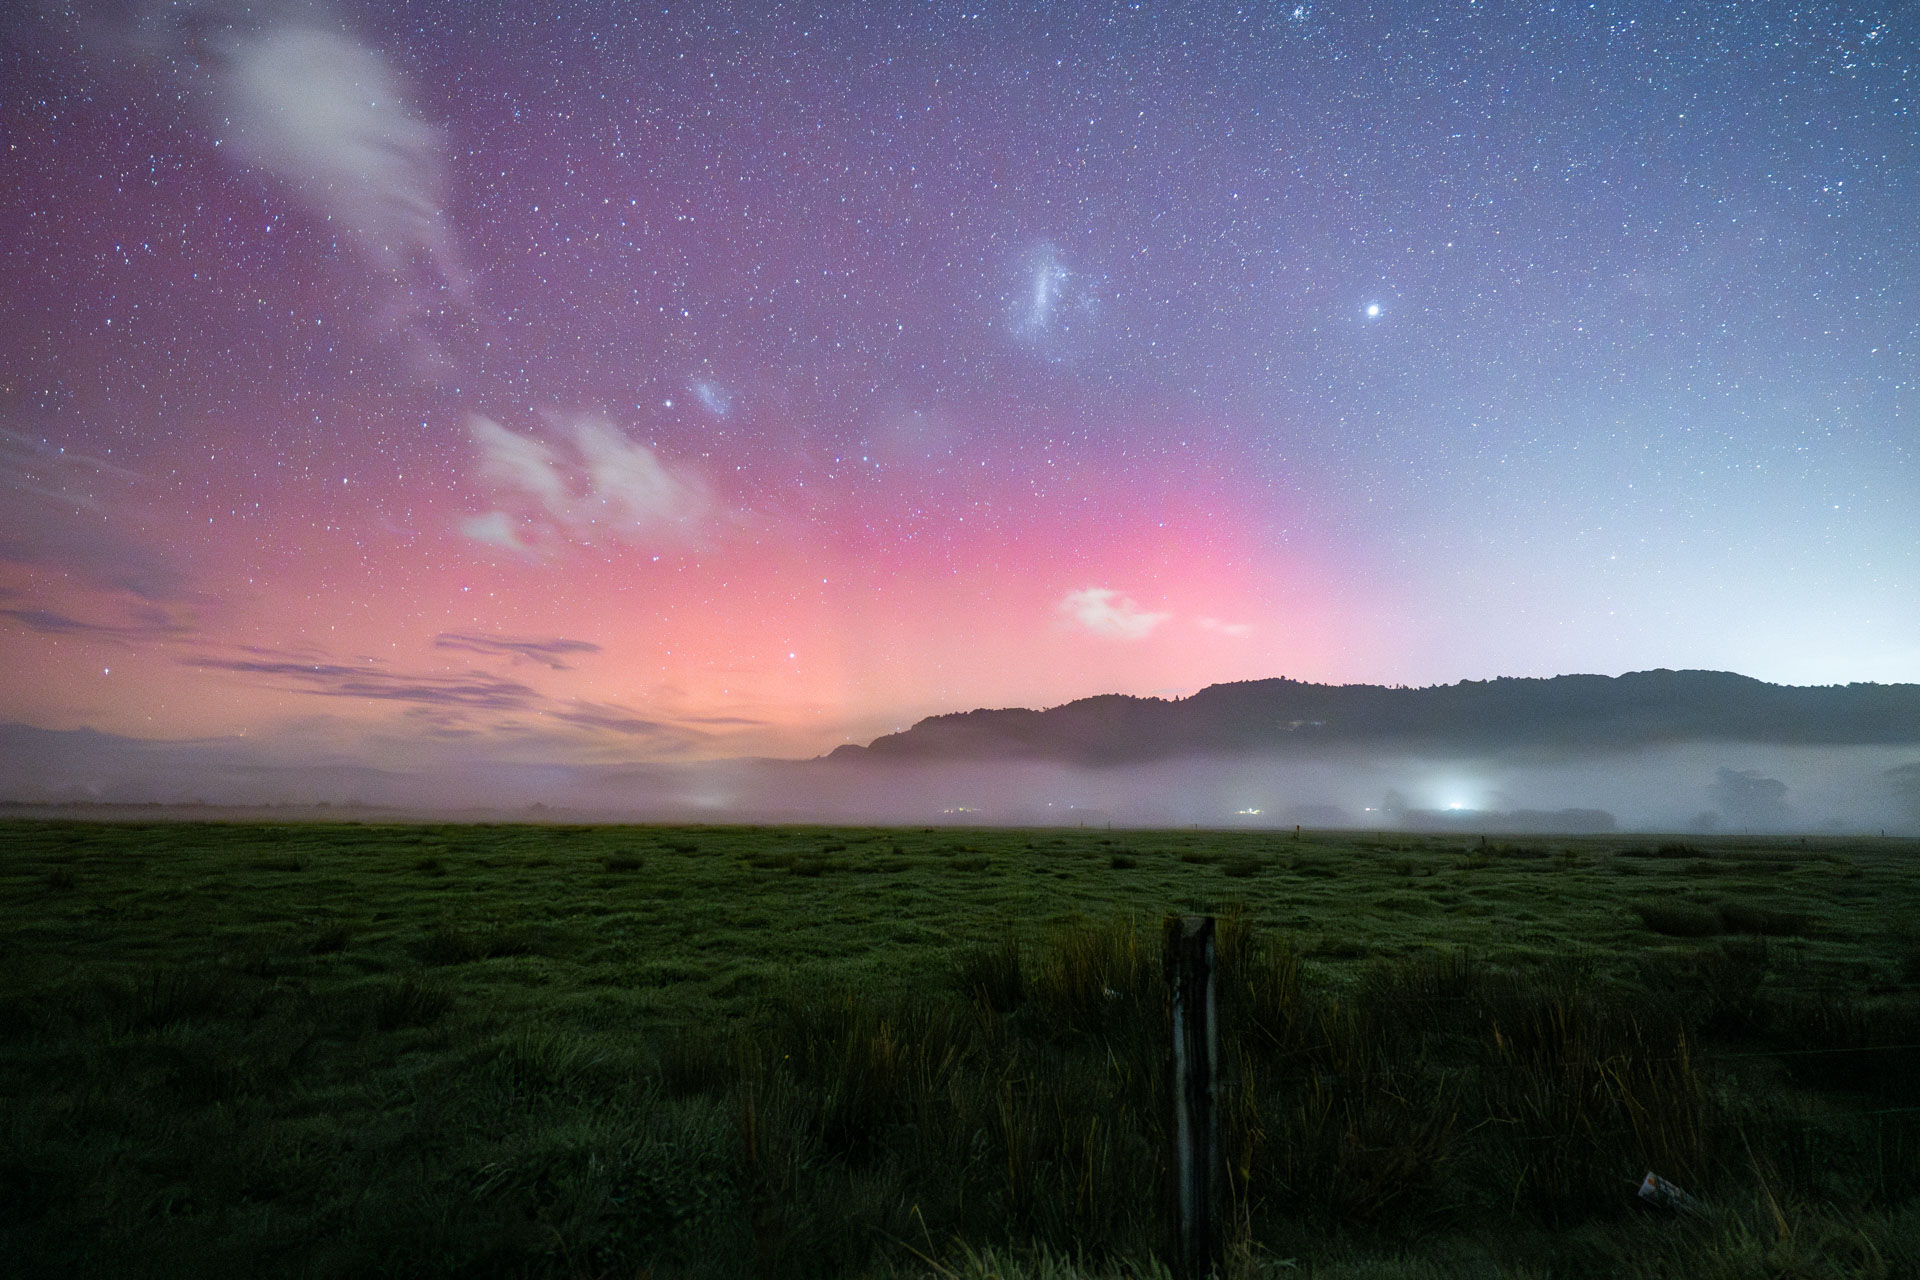
Referenced to the South Island. Dark skies and a clear southern horizon still matter enormously. A 45 percent night from a black sky site beats a 60 percent night from a suburban backyard.
Aurora at our latitudes usually doesn't build gradually. It arrives in a burst, and that burst is a substorm.
Here's the mechanism. While the field is southward, energy loads into Earth's magnetotail and the field stretches out behind the planet like a drawn bow, storing more and more energy. At some point it can't hold any more, the tail reconnects, and the stored energy snaps back toward Earth, firing particles down the field lines into the atmosphere. That's when the sky goes off.
The app runs a dedicated substorm engine separately from the headline score. It integrates the coupling function over rolling 30 and 60 minute windows to measure how much energy has loaded, and at the same time scans the Eyrewell magnetometer for the ground signature of an onset already underway.
From that it produces a probability of onset in the next 30 and 60 minutes, and a status:
That last one is the payoff. When the Canterbury magnetometer registers a bay, the app isn't predicting anything. It's telling you a substorm is underway over New Zealand at this moment.
The substorm index from the app, right now
Tonight's moon, from the app
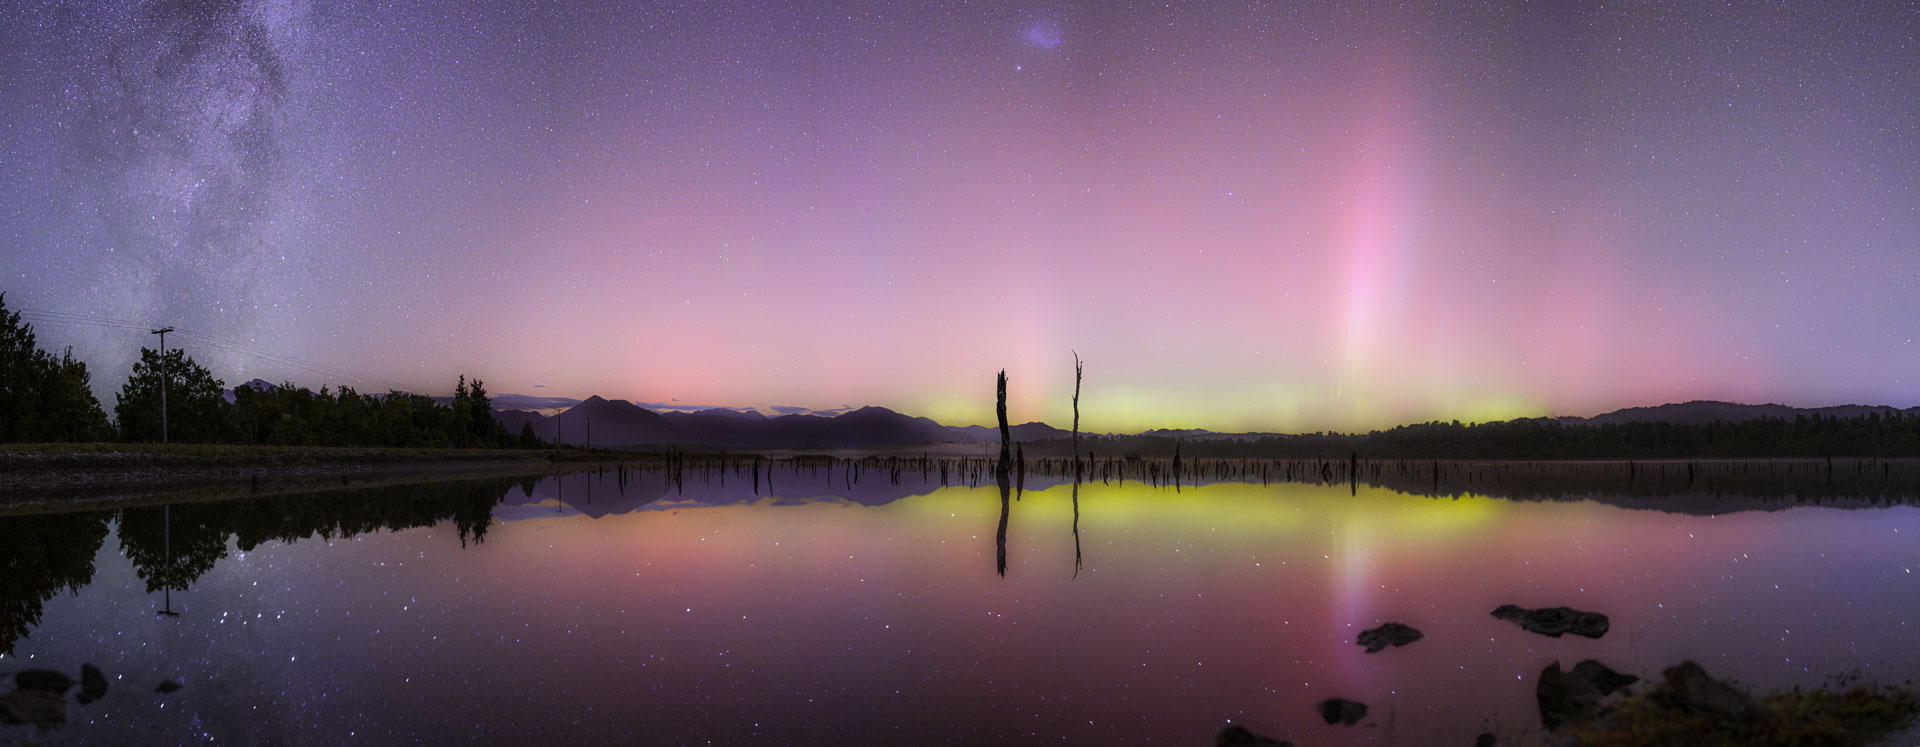
This is the part other apps miss, and it's the difference between a good night and a wasted tank of petrol. A 40 percent aurora under a new moon is a lovely display. The same 40 percent under a full moon overhead is a faintly green sky you'll struggle to convince anyone about.
The app works out where the moon actually is, for your location, at the time each forecast is for: how much of it is lit that night, and how high it sits in your sky at that hour. Then it takes its share off what you would otherwise see:
Any forecast that doesn't tell you its limits isn't worth trusting. Here are ours.
Every formula summarised here is documented in full inside the app, in its own technical documentation section. Exact coefficients, thresholds, refresh rates and sources. Nothing is a black box.
Free, no ads, made on the Coast. Open it in your browser, add it to your home screen, and stop missing nights you never knew were happening.
