
Coronal holes properly, a look three days ahead, and a lot more of the Sun
The biggest release the app has had. Coronal holes went from one visualisation to something the whole app understands, the sunspot tracker got real magnetic data behind it, the forecast now looks days ahead as well as minutes, and a lot of the physics was rebuilt so it shows what is actually happening rather than a picture of it.
New
- Coronal Hole Tracker. Every coronal hole on the disk, found live from the SUVI imagery, with its size, estimated wind speed, magnetic polarity from the HMI magnetogram, and when its high speed stream should reach Earth. Every hole keeps its number for life, and its history is kept for 90 days and shared across everyone using the app: when it first appeared, its size and stream speed at every sighting, and when and why it went, closed, merged into another hole or turned off the edge of the Sun. Holes split by a thin bright sliver are joined into the one hole they are.
- Coronal holes and sunspots on the 3D Sun. The holes and active regions now sit on the Sun in the CME visualisation, turning with it. Scrub the timeline and every hole is shown as it was at that moment, in the shape it had then: opening, growing, and gone once it closed or turned away.
- High speed streams that grow over time. Each stream is built from the wind its hole has actually blown over the last seven days, or since the hole formed, at the speed measured at each reading. Faster wind piles up behind slower wind the way it does in space, and when a hole closes its last wind drifts off on its own.
- Experimental Interactions - CMEs and HSS. A toggle in the menu. Every particle in a CME is simulated: high speed streams act as walls a CME cannot spread through, and a CME that catches another one squeezes it rather than passing through it.
- Arrival windows, not guesses. Every CME and coronal hole stream due at Earth gets an arrival window worked out from the uncertainty in each one rather than a single guessed time. The impact graph was rebuilt on the same forecast.
- The app's own three day aurora forecast. NOAA's Kp forecast is gone. In its place, every hour for three days shows what you could see from where you are, a full block for naked eye, two thirds for a phone, a third for a camera, allowing for daylight, twilight and the Moon, with a marker when a coronal hole stream or a CME is due.
- Magnetotail. A live scene of how aurora is born, driven by the solar wind being measured right now. You watch the tail load up, stretch and snap.
- Russell-McPherron effect. A plain answer to whether the time of year and time of day are helping or working against the aurora, and which hours a stream is most likely to do something.
- Oval forecast timeline. A slider under the sightings map that runs the auroral oval and view line forward in five minute steps, up to two hours ahead.
- Solar wind structure. Works out what kind of solar wind we are sitting in, shock, sheath, CME or fast stream, draws it as an animated cross section, and says what that means for tonight.
- Region labels everywhere. Sunspot regions and coronal holes are labelled on every solar image, the raw SUVI frames, the difference imagery and the fullscreen views, and they sit on the spots rather than beside them.
- Night mode. A red filter to protect your dark adaptation at the site, which can turn itself on two hours after sunset.
- Storm Builder. Replaces Solar Surfer. You get a job, aurora of a certain quality over a certain town at a certain time, and only the Sun end to work with: aim the eruption, pick its speed and set the twist of its flux rope. Real storms like May 2024 are in there too, to watch play out.
- New alerts. Earth directed CME launched, with a minimum speed you set yourself, and solar flare peaked, confirmed by watching the flux actually fall.
- CME orientation. The tilt of each CME is worked out from the coronagraph views and the region it came from, and the 3D model draws it that way.
- Inside a high speed stream. Streams in the 3D view show their three parts, the compression at the front, the fast wind and the rarefaction behind, and the impact graph marks when each is due.
- 3D explainers. How aurora forms in the magnetotail, why the equinoxes boost the aurora, and how the solar wind is structured, as interactive 3D animations.
- A new coronagraph. SWFO-L1's CCOR-2 joins the coronagraph imagery.
- Page views. Settings shows how many times the app has been opened today, this week and all time, and how many times you have opened it, updating live.
Improved
- The flux rope is drawn to scale with a cross section, and its core shows which way Bz is about to turn.
- SUVI imagery is kept for a week and played back smoothly, without the 24 hour playback being cut off by the next data refresh.
- Faster to open. The data the first page needs starts downloading with the page itself, a week of charts is kept between visits so only what is new is fetched, and the solar imagery loads quietly in the background once the app is up.
- The sunspot close up plays smoothly, fading between frames with the region held steady in the middle, and zooms in closer on it.
- CME Visualization playback runs smoothly at every speed, rather than stepping through like a slideshow.
- Weak connections. Live data now updates gracefully on a patchy signal, using less data.
- Forecasts are checked. Every arrival forecast is now scored against what actually turned up, so it can be held to account.
- A new look behind the dashboards, with a star field, a drifting moon in its real phase, and a subtle aurora.
- Notifications are plainer, with no emojis, and each alert has its own icon and status bar badge.
- Playback up to 20x on every timeline in the app. The faster speeds step over frames instead of stalling.
- The Coronal Hole Tracker scrubs and plays smoothly over a whole week: the imagery never blanks, and the outlines stay on the holes as the Sun turns.
- Coronal hole outlines on the sunspot tracker turn with the Sun as you scrub back through the frames.
- When NASA's DONKI service is down, the app still opens, CMEs and flares are kept for a week, and a NASA offline badge says so. The app also follows DONKI to its new home at CCMC.
- Solar magnetogram and intensity images refresh every 15 minutes.
- Flare and substorm alerts come once for each level you subscribe to, then once at the peak, and substorm alerts follow the visibility levels you chose.
Notifications, fixed and working
Notifications were quietly broken in more ways than one. Some alerts could never fire, and others fired but only reached some of the people who asked for them. Every one of these is fixed, and the alert checks are now tested against replays of real storms, minute by minute, so a check that stops firing is caught before a storm is missed.
- They reach everyone. Notifications were only going to the first two thousand subscribers. They now go to every subscriber, and a large send no longer repeats to the same people or stalls part way.
- CME shock alerts work. The check that spots a CME hitting the L1 satellites never actually ran, and a missing temperature reading, which is common in the live feed, blocked every shock. Both are fixed, the message now quotes the speed, density and field either side of the shock, and each shock is announced once rather than twice.
- Nothing stops the checks. One missing setting used to stop every scheduled check, flares, CMEs, shocks and visibility, from running at all, while the worker reported a quiet Sun through a real storm.
- Visibility alerts at your level. If you only ticked phone camera and the aurora went straight to naked eye, you heard nothing all night. You now get the highest level you ticked that the aurora reaches. The camera level, which could never be reached, now can.
- Flare alerts come once for each level you subscribe to as the flare climbs, then once when it peaks.
- Substorm alerts have a switch for each stage, every stage gets through, and they follow the visibility levels you chose.
- CME alerts keep coming when NASA's DONKI service or the app's own proxy is down, and the nightly outlook is sent once a night rather than sometimes twice.
- Each alert has its own icon and status bar badge, and the messages are plain, with no emojis.
Every alert you can turn on in the app, each with its own icon:
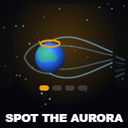
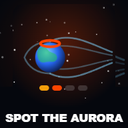
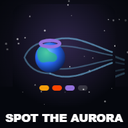
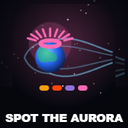
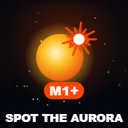
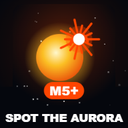
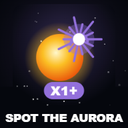
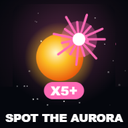
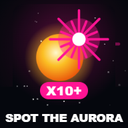
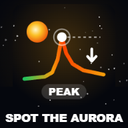
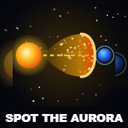
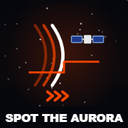
Watch the bars under the substorm icons. The four bars are a countdown. Each stage of a substorm lights one more, so at a glance, even from the lock screen, you can tell how far through the build-up we are and how close the next eruption of aurora is. One bar means energy is building in the magnetotail, two means an eruption is likely, three means it is imminent, and all four means it is happening now. The ring around the Earth takes the colour of the newest bar.
One bar
Two bars
Three bars
All four
The sunspot tracker, in depth
The sunspot tracker used to show NOAA's once a day list of regions on today's picture of the Sun. It now keeps track of every region over time, from the moment it forms to the day it turns off the edge of the Sun.
- Where each region is, every twelve minutes. Positions come from SDO's HMI instrument, which tracks each region's magnetic patch as it moves, instead of a daily bulletin carried forward. The labels sit on the spots.
- Two weeks of every change. Every fifteen minutes, the app's own sunspot history service records each region's state whenever anything about it changes: its magnetic class, its McIntosh class, how many spots and how much area it has, NOAA's chances of a C, M or X flare and a proton event, its magnetic flux and magnetised area from HMI, and the flares it has produced. Each change is timestamped and kept for two weeks.
- Scrub back through a week. Step the imagery back through up to seven days in three views: the colourised magnetogram, the black and white magnetogram and the intensitygram. Every frame shows the regions that were on the Sun at that moment, as they were then. A region appears on the frame where it first formed and is gone after it faded or turned away, with its class, spots and label colour from that time.
- Watch a region form. The close up follows the region you pick through the frames, held steady in the middle and fading between frames. Before the region formed, the close up stays on the patch of surface it came out of, so you can watch it emerge.
- History charts for each region. Tap a region for charts of its C, M, X and proton flare chances, sunspot area, number of spots, magnetic flux, magnetised area and growth rate. Each line is coloured by level, green through yellow, orange and red to purple, the same way the X-ray flux chart is. The charts cover the same stretch of time as the imagery you have chosen, and a reading stays put under your finger.
- Growing or shrinking. Each region's area and spot count are compared with a day earlier, so it is marked growing, shrinking, stable or mixed. New magnetic field coming up shows in the flux hours before it shows in the spot count.
- Is it aimed at us. Each region is placed on its trip across the disk: still too far east, in the zone where a CME from it could reach Earth, or past it. The app counts down to when it enters that zone, and adds up NOAA's flare chances over the time it stays pointed at us.
- Flares on the regions that made them. NASA's flare records are matched to their regions, so each region shows the flares it has produced.
- Coronal holes alongside. Coronal hole outlines can be shown on the same imagery, and they turn with the Sun as you scrub back through the frames.
Fixed
- An old version of the app could keep running after an update.
- Data on a page left open for a long time could quietly stop updating.
- Sightings posted close together could be lost.
- CMEs that NASA measured without a longitude were missing from the CME list.
- The sightings map no longer shows the "API key required" watermark across it. CARTO started requiring a key for its map tiles, and the app now has one.